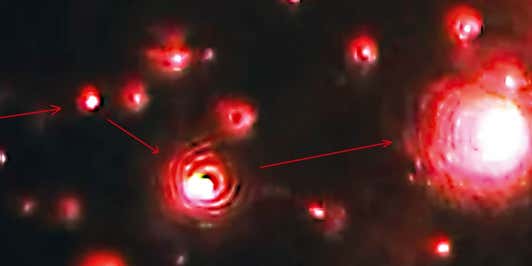
Seeing the Full Picture: Combining NTA and DLS for better particle characterisation

Rewatch the webinar below and read on to see all of your questions answered.

Thank you to everyone who joined our recent webinar, Seeing the Full Picture: Combining Nanoparticle Tracking Analysis and Dynamic Light Scattering for Better Particle Characterisation.

We always value the opportunity to connect with existing and prospective customers, hear more about the challenges you are facing, and explore how our expertise can help you find the right solutions. Webinars like this give us a brilliant way to share practical knowledge, answer real-world questions, and demonstrate how the right analytical approach can deliver clearer, more confident particle characterisation.

Whether you joined us live or are catching up now, we hope you find the webinar useful and the questions and answers insightful

You can also sign up to our next Zetasizer webinar about the importance of zeta potential by clicking this link: From Size to Stability: Why Zeta Potential Is the Missing Piece. 


Your webinar questions answered

Which technique is useful for the samples of irregular shape particles such as micro and nanoplastics?
Both Dynamic Light Scattering (DLS) and Nanoparticle Tracking Analysis (NTA) techniques use the Stokes-Einstein Equation to relate the particle diffusion to particle size based on the assumption for the Stokes frictional coefficient of smooth spherical particles. Irregular shaped particles exhibit characteristic flickering in NanoSight capture, the size derived from Brownian motion represents a spherical particle moving with same diffusion as the irregular shaped one.
This information about the irregular shape is not included. If particle shape is of interest, Malvern Panalytical’s Morphologically Directed Raman Spectroscopy (MDRS®) provides a suitable alternative. Microplastics can be analyzed using this automated imaging technique, which enables the independent characterization of individual particles within complex mixtures. MDRS delivers complementary data on particle size, shape, and chemical identity. 
Can "Zetasizer ultra red" measure the change of particle concentration as time went by in aggregation experiment?
Particle concentration is a parameter that can be used to measure changes in your aggregation experiment. However, samples containing particles above 500 nm in in diameter are likely to be unsuitable for MADLS measurements (which are used to determine particle concentration).
So NTA can only be used for samples which are fluorescence active? Also, how about sample fluorescence outside your filter range?
NTA is not limited to fluorescently active samples. NTA can analyse a wide range of nanoparticles using standard light scatter mode, where particles are visualised based on scattered laser light and do not need to be fluorescent. Fluorescence NTA is an optional, additional measurement mode.
It is used when particles are fluorescently labelled or inherently fluorescent and allows for improved specificity by detecting only particles emitting within the selected fluorescence filter range.
If a sample emits fluorescence outside the filter range, that fluorescence will simply not be detected in fluorescence mode. However, this does not prevent analysis - the same sample can still be measured in light scatter mode regardless of its fluorescence properties .
Which is the best way to store the sample chamber of the NanoSight?
The sample chamber should ideally be stored clean and completely dry, protected from dust, and kept at room temperature when not in use. Proper cleaning and drying help prevent salt crystallisation, microbial growth, or contamination that could affect future measurements. For NanoSight Pro systems, the sample chamber can be conveniently kept in the dedicated storage pocket inside the instrument, which provides protection during storage.
What setting to use on the software when analyzing EVs?
For extracellular vesicles (EVs) on the NanoSight Pro, the recommended starting point is to use the Auto Setup function, which automatically configures the exposure time, gain and focus settings.
Alternatively, for manual setup, first adjust the focus until all particles are clearly visible. Then gradually reduce the exposure/gain until the smallest particles just begin to disappear from the field of view. This helps optimise sensitivity while minimising background noise and avoids oversizing larger particles.
Consistent settings should be used across comparable samples to ensure reliable and reproducible EV measurements.
What setting to use on the software when analyzing EVs using DLS? should I select liposomes as material?
The material properties is not required for taking an average size by intensity measurement. The properties are required when the intensity size distribution is transformed into a volume or number distribution, or for particle concentration measurements. 
For EVs, we suggest using these values shown below in this table: 
Further information can be found in this insight: refractive index for nanoparticles - DLS - light scattering | Malvern Panalytical.
What does a correlogram intercept above 1 mean? and is the data still usable?
A measured intercept value of greater than 1 normally means that the sample contains very large particles/aggregates/dust which are causing an interference with the measurements i.e. number fluctuations are present. This may make the result unreliable. In this case, it is recommended that the large particles are removed by filtration or centrifugation or allowed to naturally sediment over an extended period and the sample remeasured.
Can NTA or Zetasizer measure the number of nanobubbles in a sample?
Yes - nanobubbles are very popular application for NTA. Nanoparticle Tracking Analysis directly measures individual particles and can therefore provide a number based particle concentration, making it well suited for measuring the number concentration and size distribution of nanobubbles. Malvern Panalytical has published application work demonstrating nanobubble characterisation using NTA: Nanobubble Applications and Characterization by Nanoparticle Tracking Analysis | Malvern Panalytical
Depending on the concentration of nanobubbles that is generated from the nanobubble generator the Zetasizer can also be suitable. Malvern Panalytical has also explored nanobubble characterization using both NanoSight NTA and Zetasizer DLS in collaboration with Moleaer, including practical considerations and complementary use of the two techniques: The Science Behind Nanobubbles - Webinar Series Q&A | Malvern Panalytical
What tool is better for nanobubbles in E+8 concentration?
For nanobubble concentrations around 10⁸ particles/mL, NanoSight (NTA) is a perfect choice. NTA is specifically designed to work in this concentration range and can provide number concentration and size distribution of nanobubbles reliably. 
Malvern Panalytical has also explored nanobubble characterization using both NanoSight NTA and Zetasizer DLS in collaboration with Moleaer, including practical considerations and complementary use of the two techniques: The Science Behind Nanobubbles - Webinar Series Q&A | Malvern Panalytical
Would the Zetasizer Pro model be applicable for GMP products release testing?
Absolutely, our Zetasizer advance range including the Zetasizer Pro model is compatible with our OmniTrust – 21 CFR Part 11 software. OmniTrust is our solution for regulatory compliance and data integrity including 21 CFR Part 11 and GMP Annex 11.  
Additional information on the OmniTrust can be found here: OmniTrust - 21 CFR Part 11 Software | Malvern Panalytical
Can a Zetasizer Pro Red be updated to Ultra Red instrument?
Yes, our Zetasizer advance family is upgradable within the same colour label - you cannot upgrade from a Blue Label to Red Label version. The Zetasizer Pro Red can be upgraded to an Ultra Red instrument – providing MADLS capabilities and particle concentration information. The upgrades can be performed onsite to minimize downtime.
Will the recording of this seminar be available?
Yes, it's at the top of this page and all our seminars and webinars are stored in the knowledge centre on our website by following this link: Malvern Panalytical's Knowledge Center | Malvern Panalytical
Can changing the light affect the movement of our nanoparticles in NTA or it's just for better detection?
Changing the light (laser wavelength) in NTA does not affect the movement of nanoparticles. Particle motion in NTA is governed by Brownian motion, which depends on particle size, temperature, and the viscosity of the medium - not on the illumination wavelength.
The choice of laser wavelength affects detection sensitivity only. Shorter wavelengths (e.g. blue) generally improve spatial resolution and smaller particle particles scatter less light than large ones. Selecting the appropriate laser is therefore important for optimizing visibility and measurement performance.
For fluorescence NTA, choosing the correct laser wavelength is essential to ensure proper excitation of the fluorescent label, so that only particles emitting within the selected filter range are detected.
Is it possible that sub-20 nm particles with low refractive index, such as biological nanoparticles/extracellular vesicles, go undetected by NTA, while still being captured by DLS?
Yes. Very small, low–refractive index particles (e.g. sub 20 nm biological nanoparticles/micelles/EVs) may be below the practical detection limit of NTA and therefore not tracked. DLS can still detect these particles because it is an ensemble technique sensitive to very small scatterers, although it provides intensity weighted rather than number based information. Used together as complimentary techniques NTA and DLS provide a more complete picture of a wide size range of samples.
Would labeling cause the skewness of the measurement using NTA?
Generally, no - fluorescent labelling does not inherently skew NTA measurements. However, if a high amount of fluorophore or dye is attached, it can increase the effective hydrodynamic size of the particles. In some cases, over‑labelling can also promote particle aggregation, which would affect both size distribution and concentration measurements.
Could you explain the differences in looking at the DLS data in intensity vs volume vs number? Is number (%) reliable with DLS?
The raw data obtained from DLS is intensity weighted- it is the most accurate distribution, to convert the intensity data into volume or a number distribution you need to know the optical properties for conversion using Mie theory. The volume and number distributions are recommended for reporting the relative amounts of particles present in the sample. 
More information can be found in the insight and application note found here: Intensity-Volume-Number: Which size is correct? | Malvern Panalytical
How do we deal with elongated particles in DLS? Can we infer any parameters or can we only observe aggregates?
For non-spherical scattering objects, DLS will give the average diffusion coefficient of the corresponding sphere. If the dimensions of a rod are known it is possible to calculate the expected hydrodynamic size. Due to the non-sphericity, the PdI or polydispersity will be higher than the PdI of a sample with only spheres of equivalent size. This is due to the fact that rods move faster along one axis than the other. In extreme cases, the distribution algorithm may even show two peaks: one roughly corresponding to the smaller rod diameter, and the other to an equivalent overall spherical size. 
In the Zetasizer advance we may be able to assess some differences in particle shape using this depolarized DLS, or DDLS method. More information can be found here:
What do you think about the impact of shape on the results, if they aren’t spherical, as octahedron or wires?
In DLS the hydrodynamic size is the size of a sphere that diffuses with the same average diffusion coefficient. More information on measuring non-spherical objects with DLS can be found here: How-to do Non-spherical DLS | nanosheets | #1 myth spheres | Malvern Panalytical
Are the standard deviation from different samples or from the multiple runs during one sample?
If referring to the standard deviation shown, it is multiple runs of the same sample, these are not biological repeats.
Does the NTA device have Zeta potential capabilities?
No, NTA instruments (including NanoSight Pro) do not have zeta potential measurement capabilities.
Zeta potential is instead measured using a Zetasizer, which is a world‑class instrument specifically designed for this purpose. The Zetasizer measures zeta potential via electrophoretic light scattering and allows samples to be measured undiluted or close to native conditions, which is extremely important for obtaining meaningful and representative zeta potential results.
 
As a result, NTA and Zetasizer are complementary techniques: NTA provides particle size and number concentration, while the Zetasizer provides surface charge (zeta potential) and dispersion stability information. 
More information on our Zetasizer advance range can be found on the link at the bottom of this page.
Can you please tell how long would it take for a NTA measurement?
A typical NTA measurement is rapid and takes about ~1 minute for the actual data acquisition. Full workflow (including setup and processing): typically a few minutes, depending on whether Auto Setup or manual settings are used and how many repeats are performed. So while the measurement itself is ~1 minute, total time per sample may be slightly longer if multiple captures or adjustments are included.
What are the main differences between the NS300 and the current NanoSight Pro model?
Overall, NanoSight Pro represents a significant step forward in ease of use, automation, data quality, and reproducibility, while maintaining the core NTA measurement principles of the NS300. The main benefits include:
-    Automated workflow including automated background processing
-    Ease of use and ergonomic laser module
-    New intuitive NS Xplore software with integrated machine learning 
-    Dedicated fluorescence mode
-    Data quality guidance 
To learn more please visit the link at the bottom of this page or talk to one of our experts.
Can DLS Ultra Red detect the concentration of residual nanoparticles in a supernatant after separation? What is its detection limit? Or would NTA be more suitable?
In general, the detection limit can be based on size and/or concentration. For evaluation of which technology is best to choose, one can remember the following: DLS has a broader range (single digit nm to microns) and needs higher concentrated samples. Now if the nanoparticles are small around 10-30nm, then the DLS Ultra Red can pick up the small particles best. 
If after separation the nanoparticles are highly diluted but a bit larger in size, then the NanoSight Pro can give very reproducible results. So, at the end, this is highly dependent on the separation technique and separation method parameters as well as sample dependent. The best option is to have both technologies side-by-side to learn the most.
I have noticed that sometimes the Z-average value is not always the same as the peak average seen on the graph on the Zetasizer Pro?
The z-average diameter is the intensity-weighted mean diameter obtained from the cumulants analysis as defined in ISO22412 (2025). The intensity PSD is obtained from a multiexponential analysis of the correlation function e.g. General Purpose, Multiple Narrow Modes or L-Curve. 
Cumulants and the distribution algorithms are different analyses. Whereas cumulants determines the mean size and an estimate of the distribution of sizes (the PdI), the distribution analyses try to determine the different modes present in the sample. Therefore, the peak mean from the distribution will not necessarily be the same as the z-average diameter even if the distribution is monomodal.
Results are not always reproducible using DLS. Why?
Do you mean reproducible or repeatable? There is a difference between these two terms. If a sample aliquot is measured a number of repeat times, you are looking at the repeatability of the results. However, if different aliquots of the same sample are measured separately, then you are assessing reproducibility. If you are asking why the results from DLS are not repeatable, it is probably due to the quality of the sample not being very high. 
The exact reasons can only be determined if we can see some measurements – if you would like us to help interpret the data from your measurements, then please send a measurement file. For ZS Xplorer software (Zetasizer Advance) you will need to export the measurement data to a *.zmes file and e-mail. If you are using a Zetasizer Nano, the measurement file will have a *.dts extension and can be attached to an e-mail and sent to us.
In MADLS, the LNP2_2 red, the peak in the higher size disappeared, why?
A normal DLS measurement is performed at a single angle and the correlation function obtained contains decay rates which are determined by the size of the particles being measured.
However, there is also an angular dependence to the decay rates - the scattering vector contains the sine of the detection angle - this means that if measurements are made at different angles, there is more information available to analyse i.e. the decay rates contained in the correlation functions are related to both particle size and detection angle.
If this information is concatenated, this extra information is the reason why MADLS gives higher resolution compared to a measurement at a single angle.
When the MADLS analysis is performed, the consistency of peaks in the distributions from the different detection angles is considered.
For example, there may be a peak at large sizes present in the forward angle data - remember that forward detection is particularly sensitive to the presence of dust or other contaminants - which is not present at the other angles. In such cases, it may be that a peak at large sizes which is present in the distribution from one angle is not shown in the MADLS distribution
Could you comment specifically on how these techniques can be used for QA of gold nanoparticle-antibody conjugates for use in immunoassays? What specific values are most meaningful as an indication of quality?

Gold nanoparticle–antibody conjugates used in immunoassays can be effectively supported by NTA and DLS as complementary QA techniques, each providing different but critical quality indicators.
NTA (NanoSight) is particularly valuable for:
•    Particle size distribution (number‑based): confirms that conjugation has not caused unexpected size increases or broadening.
•    Particle concentration: verifies batch‑to‑batch consistency and correct nanoparticle dose in the assay.
•    Detection of aggregation: the appearance of larger particles or multimodal distributions can indicate poor conjugation efficiency or instability.
DLS (Zetasizer) is well suited for:
•    Non-invasive, rapid and reliable assessment of particle size
•    Reporting the z-average diameter and polydispersity index (PdI) defined in ISO22412 (2025)
•    Detection of aggregates – DLS is a very sensitive technique in detecting aggregates and large particles.  
•    Zeta potential: understanding colloidal stability, providing information on the stability of your samples

Related Zetasizer (DLS) resources

Whitepaper

Improved component resolution with Multi-Angle DLS (MADLS)

Multi-angle Dynamic Light Scattering (MADLS) offers improvements in particle sizing resolution, sensitivity and accuracy compared to traditional single angle Dynamic ...
Improved component resolution with Multi-Angle DLS (MADLS)
 

Related Nanosight Pro (NTA) resources

Gain deeper insight into your particle measurements

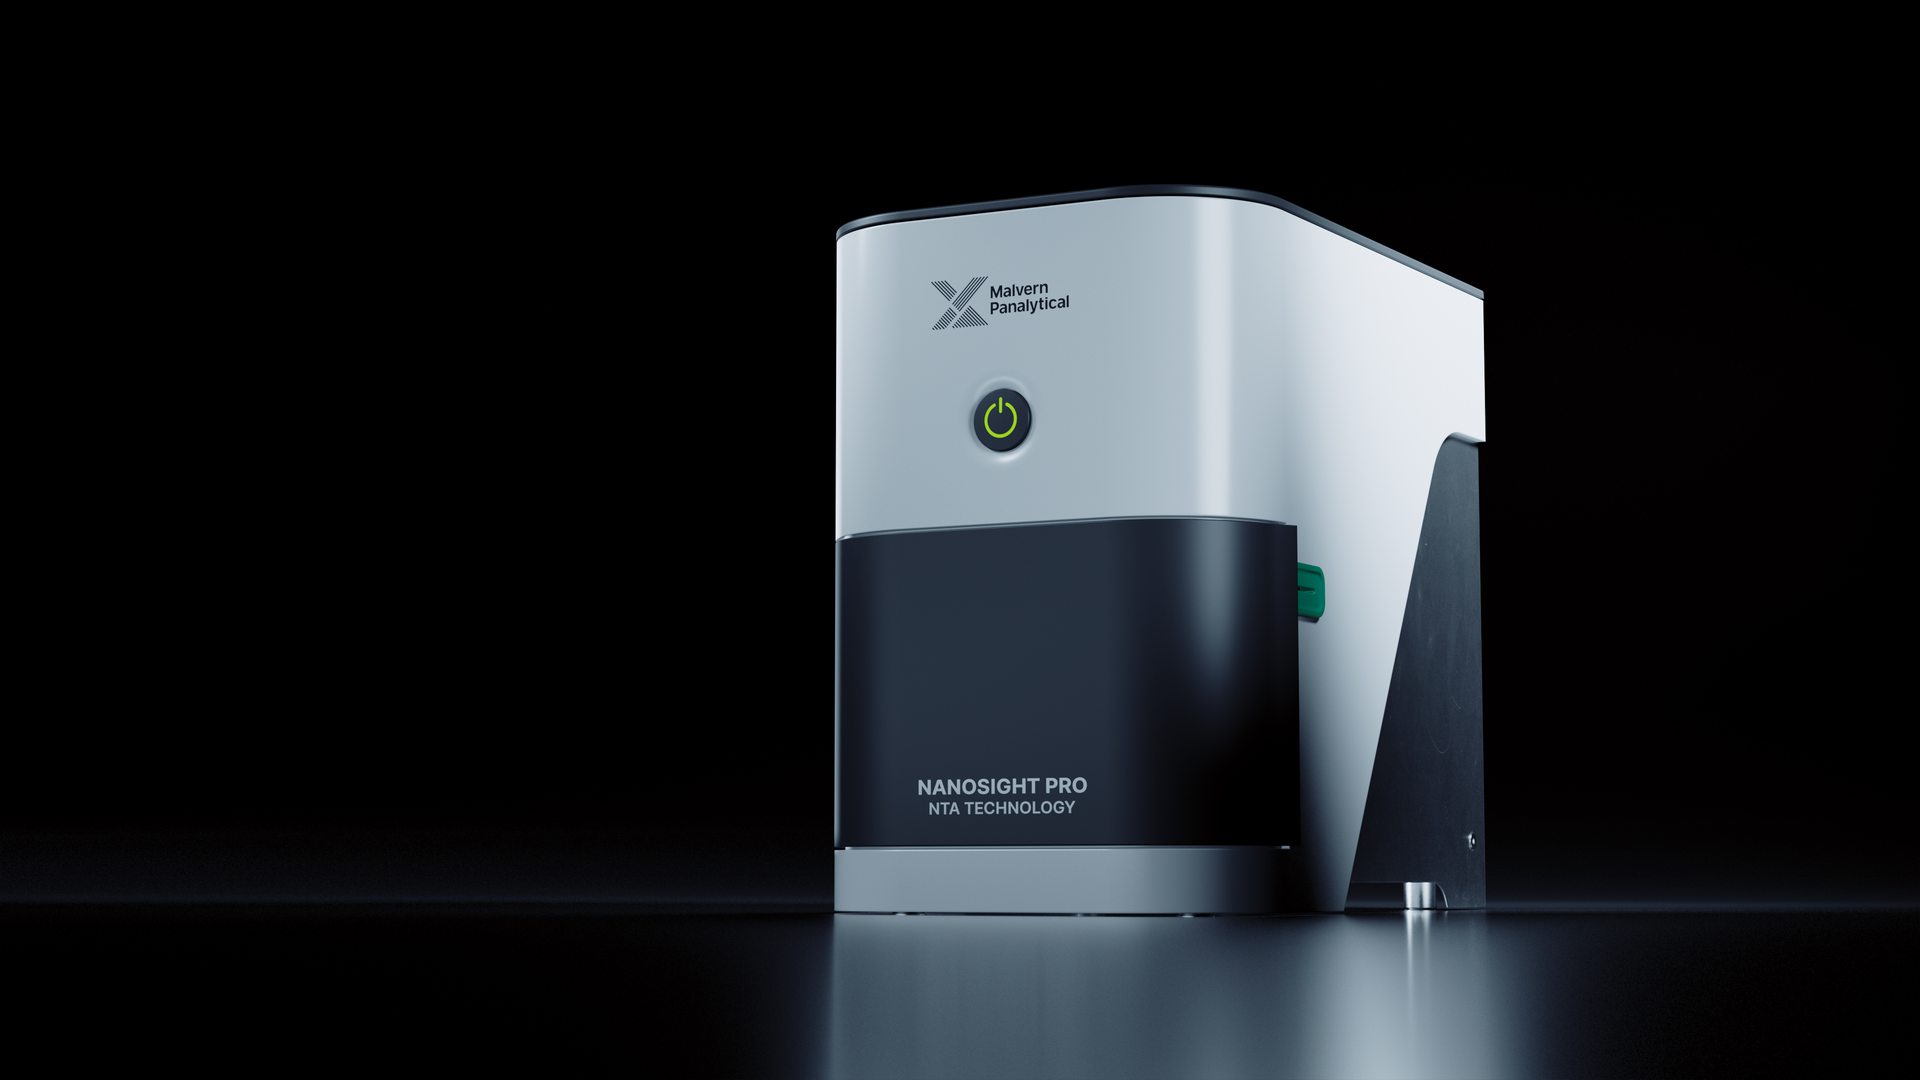
Explore NanoSight Pro and Zetasizer advance for your workflows to gain a full understanding of your samples
Revolutionary XRF, right on your bench.

Still have questions?

Book a demo or get expert advice.

Whether you're optimizing formulations, ensuring data integrity, or supporting generic development, both the NanoSight Pro and the Zetasizer are designed to meet the demands of regulated pharmaceutical environments. Our specialists are ready to understand your specific challenges - be it in R&D, QC, or manufacturing - and show you how our technology can support your success.

Fill out the form below, and a member of our team will reach out to discuss how we can help you achieve more accurate, compliant, and efficient particle sizing.


 

Speak to a Specialist

When you submit this form, we'll use your data to respond to your inquiry. You will also be opting in to our marketing. We’ll use your data to send you relevant updates on products services, promotions, education material and events related to your country, technology of interest and operating industry. You can unsubscribe at any time. For more information please read our Privacy Policy.